Drone Technology Exposes Alarming Changes in Greenland Ice Sheet
Drone data uncovers how water vapor leaves Greenland, revealing gaps in climate models and risks for sea level rise.
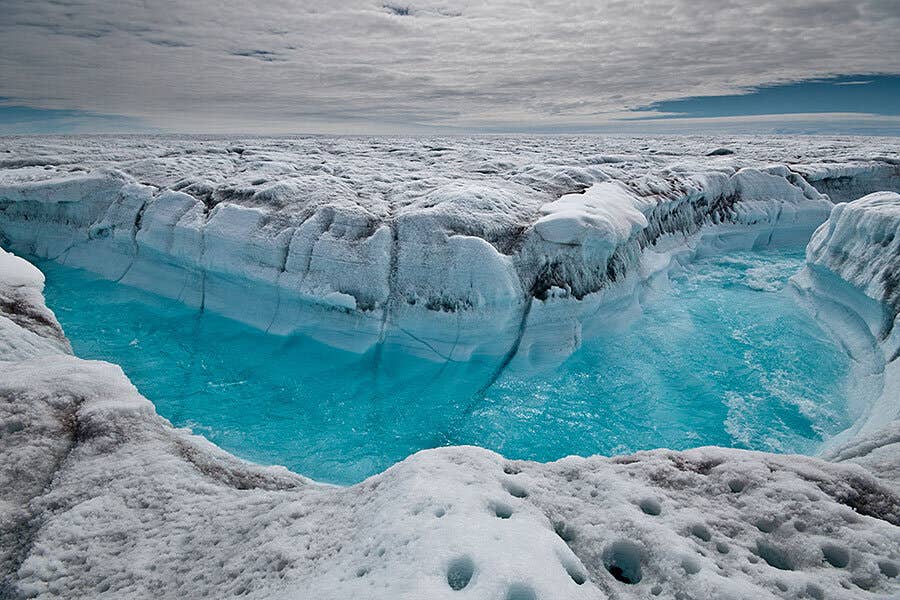
Drone-based isotope research over Greenland uncovers new insights into sublimation, water loss, and sea level rise in a warming Arctic. (CREDIT: Ian Joughin)
High over the frozen surface of Greenland, a new tool is rewriting what scientists know about how water moves through the Arctic sky. A drone, equipped with custom instruments, has provided the first high-resolution look at water vapor and its isotopic fingerprints above one of the world’s largest ice sheets. The findings are revealing a more complex water cycle than previously understood—one that may shape future sea level rise.
Researchers flew the fixed-wing drone 104 times during summer 2022 from the East Greenland Ice-Core Project camp, a remote site in northeast Greenland. Their mission: to measure the air’s water vapor and analyze its isotopes, the slightly different versions of hydrogen and oxygen that make up water molecules. These subtle differences act like fingerprints, offering clues about where water came from and how it changed on its journey through the atmosphere.
The Water Story in the Sky
Water is constantly cycling through the planet—evaporating, freezing, sublimating, and condensing. During these changes, its isotopic composition shifts in ways that reflect temperature, humidity, and mixing with other air masses. These shifts are recorded in snow, ice, and vapor, making isotopes a powerful tool for reconstructing past climate and improving future models.
Yet, until now, scientists have had little access to isotope data from the air above Greenland. Traditional aircraft missions are costly and risky in the Arctic, and ground-based towers can only sample up to 25 meters above the surface. That left a large data gap stretching up to the lower troposphere, where much of the vapor exchange happens.
“It’s like we just figured out how to discover fingerprints at a crime scene,” said Kevin Rozmiarek, a doctoral researcher at the Institute of Arctic and Alpine Research at CU Boulder and lead author of the new study. “This is a concrete step forward in understanding where water is going and where it is coming from in this important system at a time when we need it most.”
Breaking Through with Drone Flights
To fill the gap, Rozmiarek and his team turned to a large drone with a 10-foot wingspan. They loaded it with sensitive instruments to capture air samples and measure meteorological data like temperature and humidity. Each flight reached as high as 1,500 meters—or nearly 5,000 feet—above the ice sheet.
Related Stories
In tandem, the team also collected snow samples every 12 hours at surface depths of 1 cm and 5 cm. These dual data sets allowed them to link airborne water vapor to surface snow, building a more complete picture of how water moves in and out of Greenland’s ice.
One major advantage of using isotopes is their ability to capture the history of phase changes—like evaporation and sublimation—that standard weather variables miss. Temperature, pressure, and humidity don’t fully explain how water behaves in the Arctic’s extreme conditions. But isotopes hold a “memory” of where the vapor came from and what it experienced along the way.
“Isotopes are water’s fingerprints,” Rozmiarek said. “By following these fingerprints, we can trace back to the source where the water vapor came from.”
A Shifting Climate, A Shrinking Ice Sheet
Greenland holds about 8% of the world’s freshwater. Since 1992, it has lost more than 5 trillion tons of ice. Between fall 2023 and fall 2024 alone, the island lost about 55 gigatons of ice and snow, according to the National Oceanic and Atmospheric Administration. It marks the 28th straight year of net ice loss.
Most of this loss comes from melting and calving—when huge chunks of glaciers break into the ocean. But another less visible process, sublimation, may play a larger role than once thought. Sublimation occurs when snow turns directly into vapor, skipping the liquid stage.
One study from the accumulation zone of the ice sheet found that as much as 31% of snow deposited during the summer sublimated rather than melting or compacting into ice. But what happens to that vapor remains unclear. Does it fall back as snow? Recondense on the surface? Or leave the region entirely?
The new drone data suggests that models may underestimate how much vapor escapes from Greenland. The team compared their observations with an existing climate model and found that the model didn’t account for enough water being removed from the atmosphere before it reached the ice sheet. When the team adjusted the model using the isotope data, predictions of precipitation and moisture transport improved significantly.
“We demonstrated how useful water vapor isotope data is by successfully improving an existing model,” Rozmiarek said.
The Challenge of Modeling Arctic Moisture
Accurate models are crucial for projecting future ice loss and sea level rise. But modeling how water behaves over ice sheets is tough, especially when observations are lacking. Most water vapor isotope studies have focused on lower latitudes, where it’s easier to fly crewed aircraft.
In the Arctic, the physical processes are different. Surface sublimation, katabatic winds—cold, dense air flowing downhill—and extreme temperature inversions all play a role in shaping moisture pathways. Yet few models are tuned to capture these unique factors.
In the drone study, the team used a Lagrangian backtrajectory model paired with a water distillation simulator called HySPLIT-SWIM. While the model matched observations for temperature and humidity well—within a mean difference of just +0.095°C and −0.043 g/kg—it struggled to replicate the isotope profiles.
The discrepancy below the 200-meter inversion layer pointed to a likely cause: kinetic fractionation. This process occurs when different isotopes behave differently during phase changes and mixing. The drone data showed signs of vapor from sublimated snow mixing with katabatic winds, creating a complex isotopic signal not fully captured by the model.
“This result requires substantial future analysis of kinetic fractionation processes along the entire moisture pathway,” the researchers noted.
Rewriting the Water Budget
Understanding how much vapor leaves Greenland is critical to measuring its water budget. Earlier evidence from snow pits showed that sublimated snow could influence the isotope makeup of new snow downwind. But direct measurements of atmospheric vapor and its link to the snow surface were missing.
Now, with drone-based isotope profiling, scientists can begin to close that loop. By capturing data from both the source (tropical moisture) and the sink (surface snow), researchers are finally able to investigate the in-between: the moving vapor that connects them.
This matters because if sublimated vapor is lost to the atmosphere and not recycled locally, it means more freshwater is leaving the Greenland system than previously counted. That loss could accelerate sea level rise, disrupt ocean currents, and reshape ecosystems across the globe.
About 125,000 years ago, during a warm period, Greenland’s ice sheet was smaller, and global sea levels were up to 19 feet higher. Today, with rising temperatures and melting ice, scientists warn the same could happen again—this time driven by human-caused warming.
A New Path Forward
The drone study is just the beginning. Rozmiarek and his team plan to return to Greenland and expand their flights to other Arctic regions. Their goal is to build a larger data set that can inform better models, guide climate projections, and track the water cycle in real time.
“There’s still so much we don’t know,” Rozmiarek said. “We will be able to understand how water moves in and out of Greenland in the next few years.”
With the Arctic warming faster than anywhere else on Earth, every new insight matters. By tracing the invisible fingerprints of water in the sky, scientists are uncovering clues that could reshape how we prepare for a future shaped by ice, vapor, and a warming world.
Note: The article above provided above by The Brighter Side of News.
Like these kind of feel good stories? Get The Brighter Side of News' newsletter.
Rebecca Shavit
Science & Technology Journalist | Innovation Storyteller
Based in Los Angeles, Rebecca Shavit is a dedicated science and technology journalist who writes for The Brighter Side of News, an online publication committed to highlighting positive and transformative stories from around the world. With a passion for uncovering groundbreaking discoveries and innovations, she brings to light the scientific advancements shaping a better future. Her reporting spans a wide range of topics, from cutting-edge medical breakthroughs and artificial intelligence to green technology and space exploration. With a keen ability to translate complex concepts into engaging and accessible stories, she makes science and innovation relatable to a broad audience.